Hoe statistieken dodelijk kunnen zijn
Dit is deel één in een korte serie artikelen over de aard van metrieken, vooral binnen product- en softwareontwikkeling. In dit artikel gaan we het hebben over: - Vervorming van gegevens - Datageletterdheid - Ontgoocheling over gegevens
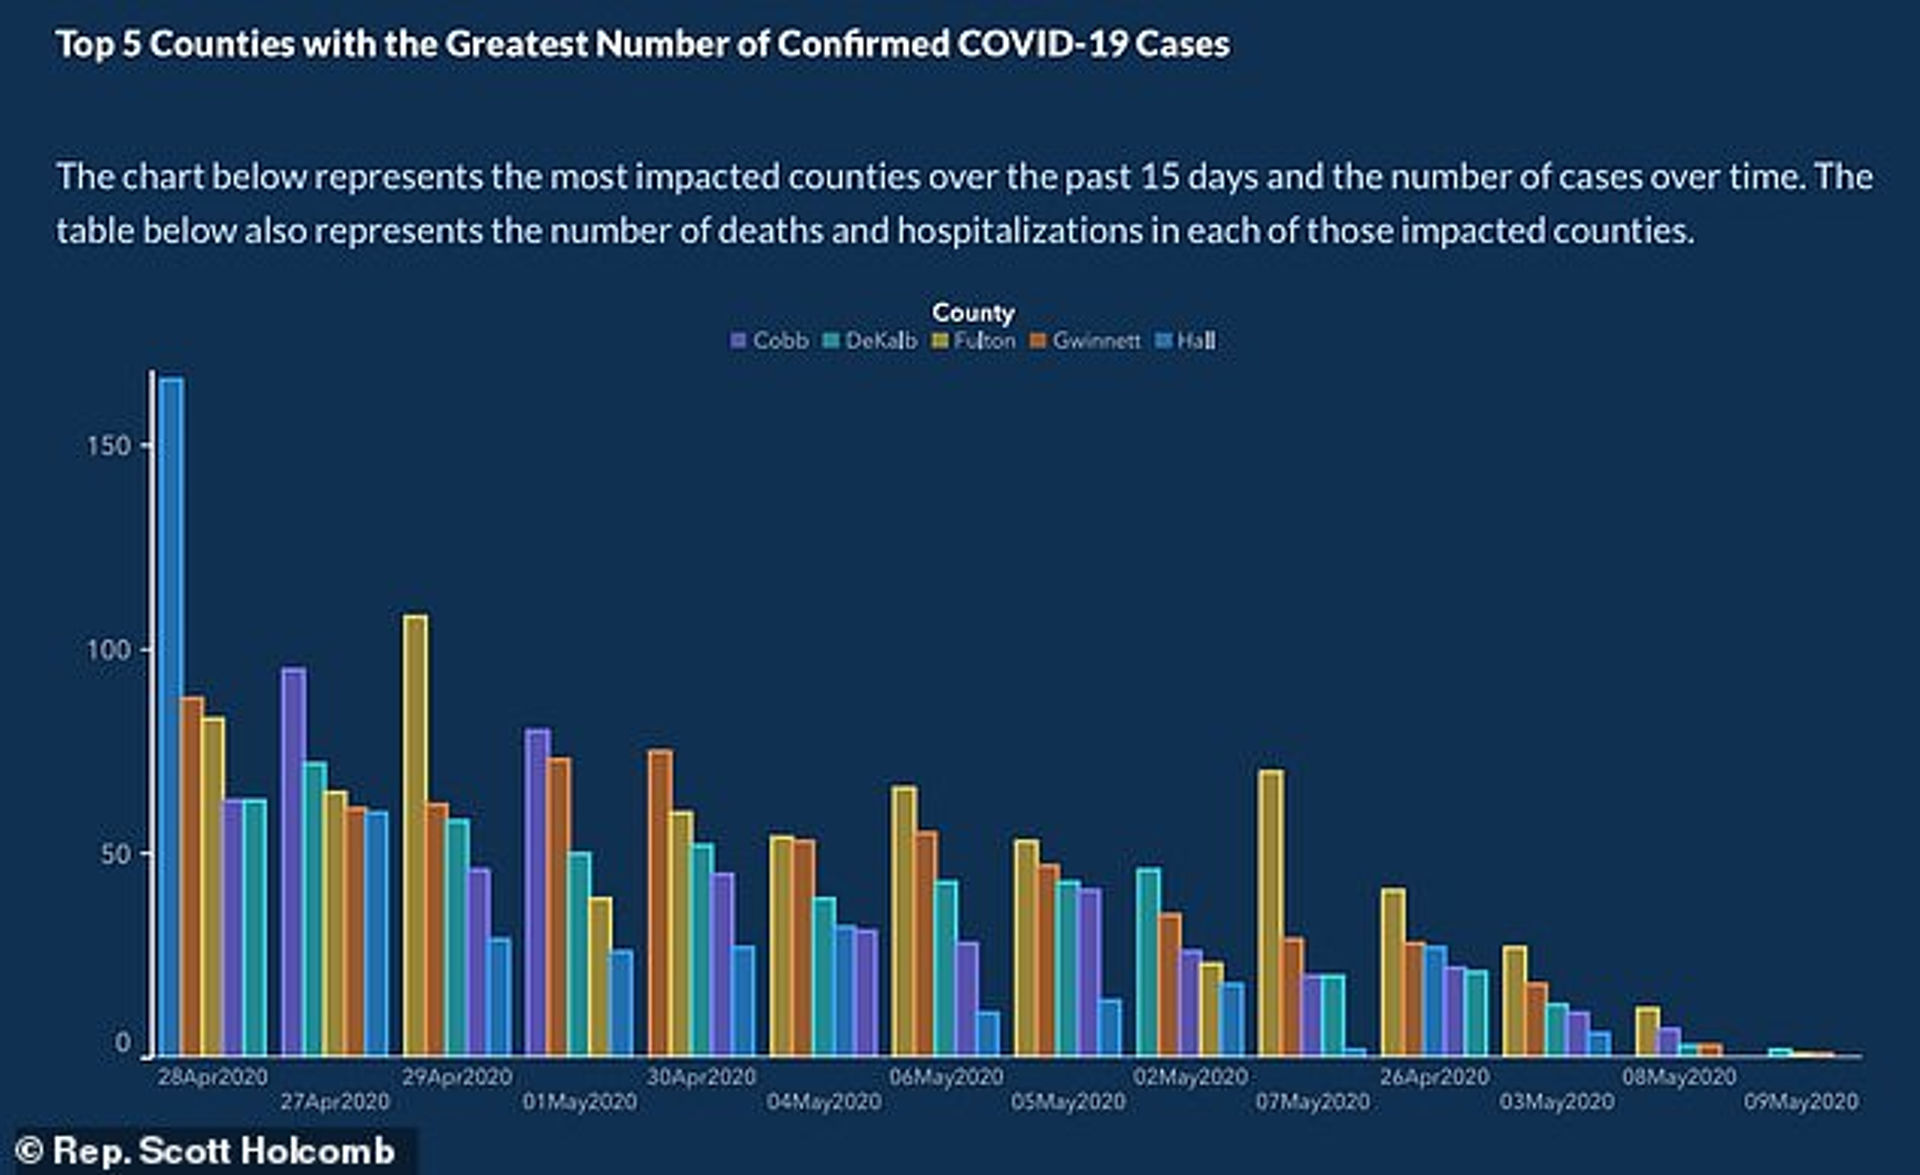
The smoking graph
On or before the 10th of May, and continuing until at least the 16th, the US state of Georgia’s Department of Public Health published a series of graphs. These graphs were created to inform the public of the status of the COVID-19 pandemic within the state. The key one was a graph tracking confirmed cases over time:
A declining curve, down to a flatline even; clearly the virus is over for Georgians.
Except the graph has been manipulated, not in a good way and it would stretch credulity to say unintentionally. The X axis, nominally “time”, is not in chronological order or in any apparent order except that of broadly declining cases. The data for each county has been intercut with others, and the sub-order isn’t even consistent, with the effect of highlighting outlier spikes and muddying contexts.
Most fundamentally and unstated on the graph, Georgia backdates tests to the earliest date the patient was symptomatic (noting that asymptomatic cases exist). Therefore, there’s a 14 day window of incomplete - essentially work in progress - data, so the later days in the graph are merely “data so far”.
Here’s what a more honest graph could have looked like for comparison:
Local reporters and then wider media at-large rapidly identified these issues and made Georgia’s DPH internet-famous. Subsequently, the DPH acknowledged the graph was not “helpful”, apologising and correcting some of the issues.
SSDD
Another infographic conveying COVID-19 metrics is the one below, in this case from the UK Cabinet Office briefing presented by the health secretary, Matt Hancock:
Did you look at the graphs first? Tests going up, cases going down right? But did you read the light grey text?
“Includes tests conducted and shipped.”
Emphasis mine. Why and shipped? Why mix the past and the future? Should a company add next year’s forecast to this year’s earnings? Does a software team include the size of its backlog in its done items? Why draw the line there, why not add the tests currently being manufactured? Or the ones we really thought we wish we had made?
“Some people are tested more than once.”
Why report more than once? That’s conflating the process of testing with the results of the tests, favouring demonstrating action over creating actionable information. Am I one customer or hundreds of customers to my local supermarket? Can that company report every dollar of profit as two because they practice double-entry bookkeeping?
“There are more cases than confirmed here.”
Indeed, there are. It has been widely reported that deaths outside hospitals, and especially in care homes, are underreported or even excluded from government statistics which may as much as double the numbers. Yet the graph indicates no uncertainty or estimate.
This presentation led the UK Statistics Authority - a government department - to publicly rebuke Matt Hancock’s statistics saying they are “far from complete or comprehensible” and concluding:
“The aim seems to be to show the largest possible number of tests, even at the expense of understanding…. This presentation gives an artificially low impression of the proportion of tests returning a positive diagnosis.” Source: UK Statistics Authority, via Twitter
Death of a metric
For the anxious public across the world, the daily number of cases or deaths has become the fundamental metric which drives the only fundamental policy decision in a lockdown (hard or soft) - i.e. when to end the lockdown? Within both the US and UK, contexts of neoconservative administrations, the desire for that metric to reach zero - or more accurately appear imminently about to - has changed the metric from an instrument into a target to justify policy. With high-stakes elections and Brexit ahead, it was almost inevitable that the metrics got gamed.
Data literacy is hardly widespread amongst the public, creating further room for direct abuse and confirmation bias to distort the objectivity of the metric simply through it’s presentation, even when the graph itself is innately legitimate.
Same data but very different reactions, and very much a case of being able to prove anything with facts. Or alternative facts. Regimes with much to lose from accurate metrics are unsurprisingly loose with that accuracy.
The informational value of these metrics in the UK and US has been rendered void in the service of a narrative, and consequently the system suffers - which is society in these cases. This has very real and tragic consequences.
This isn’t OK, and it isn’t necessary. We’ve demonstrated the power and relevance of bad metrics on a grand scale, but the point is this happens at all levels: your organisation’s metrics are not immune.
For the organisation itself, bad metrics are self-defeating; bad signals lead to bad decisions which lead to survival by chance and that is risky at best. For the people within the system, the impact can be severe.
Luckily in the next article, we’ll look at the theory behind why metrics break down, so we can start fixing the problem.
In dit artikel
Wat is uw situatie?
Laten we contact opnemen en onderzoeken hoe we jouw initiatief succesvoller kunnen maken. Wat beschrijft jouw situatie het beste?